


Key points
- Bitcoin crossed $80,000 on Monday, August 24, its first move above the level since May 15, and held near $79,000 on Tuesday.
- US spot Bitcoin ETFs drew about $1.92 billion in net inflows last week, while more than $4 billion in short positions were liquidated as BTC broke out of its summer range.
- Forecasts now run from a trader’s mapped path back to $45,000 to Bernstein’s $150,000 target, with Citi’s 12-month base case at $82,000.
Personally, I feel I shouldn’t write and talk about Bitcoin more when it rallies, but the market and the pundits never let me catch a break. So here we are again.
The Bitcoin price crossed $80,000 on Monday, August 24, its first move above that level since May 15, capping a week-long climb from the low $60,000s. BTC slipped back under the mark within hours and held near $79,000 on Tuesday, according to CoinGecko, with the month-to-date gain sitting at roughly 25%. The break has reopened a Bitcoin price forecast debate that had gone quiet through July.
The advance came with real flows behind it. US spot Bitcoin ETFs recorded around $1.92 billion in net inflows during the week, and once Bitcoin broke out of its previous trading range, those inflows combined with the liquidation of more than $4 billion in short positions to accelerate the move. CIM reported last week on Strategy’s swing back to a $1.4 billion Bitcoin profit once BTC cleared the company’s average cost.
The trader known as Nonzee reads the move as mechanical. In a post on X, they attributed the surge to forced buying by short sellers and said sentiment had not shifted. “That was not a reversal. It was a liquidity squeeze,” they wrote.
Nonzee’s projected downside path runs from $77,000 to $67,000, then $55,000, before a final leg to between $48,000 and $45,000. They tied the timing to renewed attention on the CLARITY Act and the Treasury Department’s expanded long-term bond buybacks, arguing both forced shorts out and pulled fresh longs into a stretched market.
Where Bitcoin Price Forecasts Sit After the $80,000 Break
Sell-side targets sit far apart. Standard Chartered still sees $100,000 by the end of 2026, Bernstein is sticking with a $150,000 target, and Citi’s more cautious 12-month base case stands at $82,000. Chris Beauchamp of IG said “the beginnings of an inflow revival are in play,” while stressing that institutional demand has to persist for the recovery to extend.
VanEck published its mid-August Bitcoin ChainCheck on August 18, days before the breakout. Eight of the 12 capitulation indicators the firm tracks were active as of August 12, and the report described the market as “nearing or currently in an accumulation phase.” Long-term holders sold roughly 356,000 BTC over the 30 days to August 11, pushing their share of circulating supply below 60%.
Indian Exchanges Report Higher Volumes
The rally revived activity across India’s trading venues. CoinDCX, CoinSwitch, WazirX, Mudrex and Giottus all reported increased trading activity as BTC approached $80,000, Moneycontrol reported. That follows a first half in which Indian investors bought the Bitcoin dip, trading ₹14,664 crore while Bitcoin fell about 51%, and a year in which India’s crypto SIP participation held through the drawdown.
Bitcoin still sits roughly 37% below its October 2025 record near $126,300. VanEck’s cycle work points to a possible accumulation window between September and November, leaving the coming weeks as the test both camps have set for themselves.
Editorial Note: Reported and edited by the Crypto India Magazine editorial team. We use AI tools to assist with research and drafting; every article is reviewed and fact-checked by our editors.
Interested in advertising with CIM? Talk to us!


China Seeks 61,800 Bitcoin Seized in UK Over $5.7B Fraud
Chinese prosecutors have applied to confiscate more than 61,800 bitcoin and other assets tied to a 40.378 billion yuan ($5.7 billion) fraud led by Qian Zhimin. A Tianjin court accepted the request, days after a UK court ruled Chinese law governs victims’ claims to the seized coins.

Indian Finance Minister Flags 2027 Risk as Stocks Slide and Jio Hits Crypto Rails
Indian Finance Minister Nirmala Sitharaman named capital outflows as a top 2027 risk, speaking in Bangkok as Indian stocks fell over 12% and foreign investors pulled $33 billion. The warning lands as Jio’s record IPO is already priced through Bitget’s JIOUSDT pre-IPO crypto futures.

Capital B Posts €69.5M H1 2026 Loss Despite Buying More Bitcoin
Capital B reported a €69.5 million ($78M) net loss for the first half of 2026, with about 97% of it a non-cash Bitcoin impairment tied to the June 30 price. Revenue rose 3.5%, and the French treasury company kept buying, holding 3,538 BTC by September 30, up 25.3% since January.
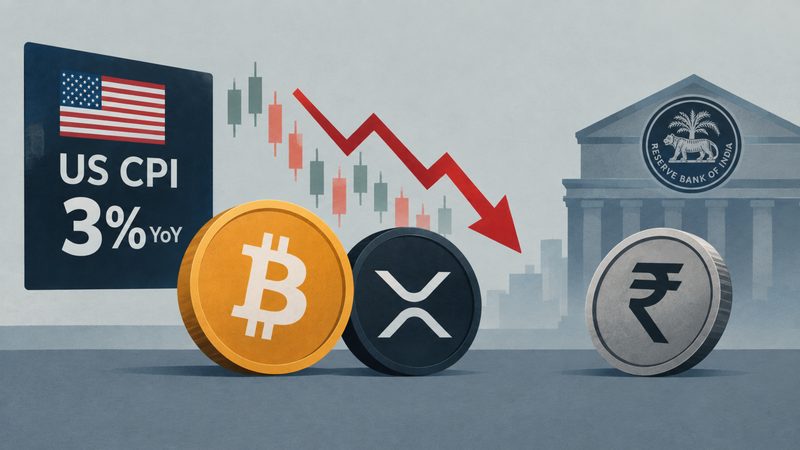
Rupee Near Record Low Splits Bitcoin and XRP Prices in India From the Dollar
The delayed US September CPI came in at 3% and crypto sold off, with Bitcoin below $81,000 and XRP down over 4%. With the rupee near a record low and the RBI intervening, Bitcoin and XRP prices in India can move differently from their US dollar charts. Here is why that happens.